Spotting Market Peaks The Story of the Shooting Star Candlestick Pattern
In the ever-evolving world of trading, recognizing early signs of a trend reversal can be a game-changer. Among the most reliable indicators of a potential market top is the shooting star candlestick pattern. This visually striking formation often signals that bullish momentum is fading and that a bearish reversal may be on the horizon. Understanding the shooting star can help traders make informed decisions and stay ahead of market shifts.
What Is a Shooting Star Candlestick Pattern?
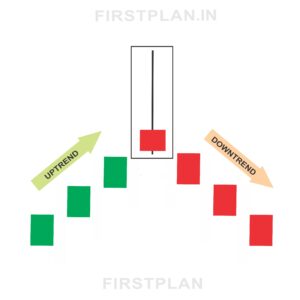
A shooting star candlestick is a bearish reversal pattern that appears at the top of an uptrend. It tells a story of a session where buyers initially pushed prices higher, but sellers ultimately seized control, driving the price back down by the close. This pattern serves as a warning that the market’s upward movement may be losing steam, and a downward shift could soon follow.
Key Features of the Shooting Star
To accurately identify a shooting star, look for these distinctive characteristics:
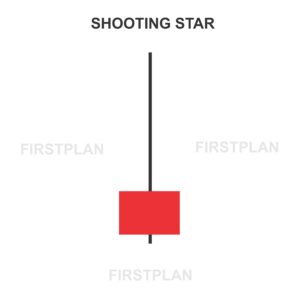
The body of the candlestick is relatively short, indicating that the opening and closing prices are close together. This narrow range reflects uncertainty and a potential shift in sentiment from bullish to bearish.
Above the body, you’ll notice a long upper wick—at least twice the length of the body itself. This shadow represents the buyers’ initial attempt to push prices higher, only to be met with strong selling pressure that pulls the price back down.
There is little to no wick below the body, showing that the price remained near its session low for both the open and close. This reinforces the idea that sellers dominated the session’s end.
The body can be red (bearish, where the close is lower than the open) or green (bullish, where the close is higher than the open). A red body is generally considered a stronger signal, as it shows sellers managed to close the session below the opening price.
Visualizing the Shooting Star
The shooting star candlestick is easy to spot on a price chart. It resembles an upside-down “T,” with a small body at the bottom and a long wick stretching upward. This unique silhouette makes it a favorite among technical analysts for identifying potential market tops.
What Does the Shooting Star Signal?
The appearance of a shooting star at the top of an uptrend is a sign that bullish momentum may be waning. Buyers managed to drive prices higher during the session, but sellers quickly stepped in, pushing the price back down before the close. This shift in control suggests that the market could be preparing for a reversal to the downside.
Real-World Example of the Shooting Star
Let’s bring this pattern to life with a practical example. Imagine a stock that opens at ₹100. During the session, buyers push the price up to ₹120, but by the close, it falls to ₹98. The price action for the session looks like this:
This configuration forms a classic shooting star, signaling that sellers have taken the upper hand and a bearish reversal may be imminent.
How to Trade the Shooting Star Pattern
Recognizing the shooting star is just the beginning. To trade this pattern effectively, consider these best practices:
Look for a bearish candlestick in the next session to confirm the reversal. This follow-up candle should close lower, reinforcing the signal that sellers are gaining control. Increased trading volume during the shooting star or the confirmation candle adds further weight to the pattern.
Once confirmation is established, consider entering a short position below the low of the shooting star. This strategy allows you to capitalize on the potential downtrend from the outset.
Always protect your position by setting a stop loss just above the high of the shooting star. This risk management technique helps limit losses if the anticipated reversal does not occur.
Variations and Related Patterns
The Inverted Hammer
A closely related pattern is the inverted hammer. While it shares a similar shape with the shooting star, the inverted hammer appears at the bottom of a downtrend and signals a potential bullish reversal. Recognizing the context in which each pattern forms is crucial for accurate analysis.
Why the Shooting Star Matters for Traders
Mastering the identification and interpretation of the shooting star candlestick pattern can give traders a significant edge. By spotting this early warning sign, you can adjust your positions, manage risk more effectively, and seize profit opportunities before the broader market reacts.
Final Thoughts
The shooting star candlestick is a powerful tool for anticipating market reversals at the peak of an uptrend. Its distinctive appearance and clear message make it an essential pattern for traders seeking to stay ahead of the curve. By combining keen pattern recognition with disciplined trading strategies, you can harness the power of the shooting star to make smarter, more profitable trading decisions.
Whether you’re a seasoned trader or just starting out, learning to spot and interpret the shooting star candlestick can open the door to better timing and greater success in the markets.