Spotting the Turning Point The Power of the Inverted Hammer Candlestick in Trading
In the world of technical analysis, few patterns capture the drama of a market reversal quite like the inverted hammer candlestick. This unique formation often signals that a downtrend may be losing steam and that a bullish turnaround could be just around the corner. For traders and investors seeking to capitalize on emerging opportunities, understanding the inverted hammer is an essential skill.
What Is an Inverted Hammer Candlestick?
The inverted hammer candlestick is a bullish reversal pattern that typically appears at the bottom of a downtrend. Its presence on a chart suggests that, despite sellers dominating the early part of the session, buyers gathered strength and attempted to drive prices higher. Even if the session closes near its low, the pattern hints that the tide may be turning in favor of the bulls.
The Story Behind the Pattern
Imagine a market in decline, with sellers confidently pushing prices lower day after day. Suddenly, during a trading session, buyers step in with renewed vigor. They manage to push the price up significantly, but by the end of the session, sellers regain some control, pulling the price back down. Even though the close is near the session’s low, the fact that buyers were able to mount such a strong rally is a key signal that bearish momentum is weakening.
Key Features of the Inverted Hammer
To accurately identify an inverted hammer, look for these defining characteristics:
The candlestick’s body is relatively short, indicating that the open and close prices are close together. This narrow range reflects uncertainty and a potential shift in sentiment.
Above the body, you’ll see a long upper wick—at least twice the length of the body itself. This shadow represents the buyers’ attempt to push prices higher during the session, a sign of emerging bullish interest.
There is little to no wick below the body, showing that the price remained near its session low for both the open and close.
The body can be green (bullish, where the close is higher than the open) or red (bearish, where the close is lower than the open). A green body is considered a stronger signal of a potential reversal, as it demonstrates that buyers managed to close the session above the opening price.
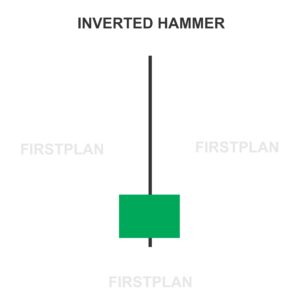
Visualizing the Inverted Hammer
The inverted hammer candlestick looks like an upside-down “T.” The small body sits at the bottom, with a long wick stretching upward and little or no shadow below. This distinct silhouette makes it easy for traders to spot on a price chart.
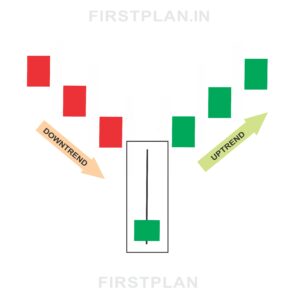
What Does the Inverted Hammer Signal?
The appearance of an inverted hammer at the end of a downtrend is a sign that the market’s bearish momentum may be fading. Buyers have shown they can push prices higher, even if only temporarily. This pattern often marks the beginning of a shift in sentiment, where bulls are preparing to take control and potentially drive prices upward.
Real-World Example of the Inverted Hammer
Let’s bring this pattern to life with a practical example. Imagine a stock that opens at $100. During the session, buyers push the price up to $120, but by the close, it settles at $102. The price action for the session looks like this:
This configuration forms a textbook inverted hammer. The long upper shadow shows vigorous buying interest, even though the session ended near its low.
How to Trade the Inverted Hammer Candlestick
Recognizing the inverted hammer is only the first step. To trade this pattern with confidence, follow these best practices:
Look for a bullish candlestick in the next session to confirm the reversal. This follow-up candle should close higher, reinforcing the signal that buyers are gaining control. Increased trading volume during the inverted hammer or the confirmation candle adds further credibility to the pattern.
Once confirmation is established, consider entering a long position above the high of the inverted hammer. This approach allows you to ride the potential uptrend from the very start.
Always protect your capital by setting a stop loss just below the low of the inverted hammer. This risk management strategy helps limit losses if the anticipated reversal does not materialize.
Variations and Related Patterns
The Shooting Star
A pattern closely related to the inverted hammer is the shooting star. While similar in shape, the shooting star appears at the top of an uptrend and signals a potential bearish reversal. Recognizing the difference between these two patterns is crucial for accurate analysis.
Why the Inverted Hammer Matters for Traders
Mastering the inverted hammer candlestick pattern can give traders a significant edge in spotting early signs of bullish reversals. By identifying this pattern at the right moment, traders can position themselves to benefit from emerging uptrends, maximizing profit potential while minimizing risk.
Final Thoughts
The inverted hammer candlestick is a powerful signal that the market may be ready to change direction. Its distinctive shape and clear message make it an invaluable tool for traders seeking to anticipate reversals and seize new opportunities. By combining keen pattern recognition with disciplined trading strategies, you can harness the power of the inverted hammer to stay ahead in the ever-changing world of financial markets.
Whether you are a seasoned trader or just beginning your journey, learning to spot and interpret the inverted hammer candlestick can open the door to smarter, more profitable trading decisions.