Unveiling the Hanging Man Candlestick Pattern: A Key Signal for Market Reversals
In the fast-paced world of trading, recognizing early signs of a market reversal can make all the difference between profit and loss. Among the many candlestick patterns that traders rely on, the hanging man stands out as a powerful warning that an uptrend may be running out of steam. This article dives deep into the anatomy, meaning, and trading strategies surrounding the hanging man candlestick, equipping you with the knowledge to spot and capitalize on this crucial signal.
Understanding the Hanging Man Candlestick
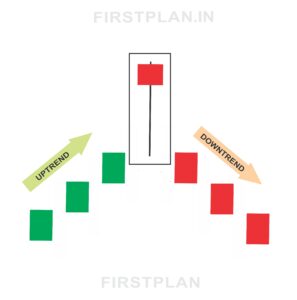
The hanging man candlestick is a bearish reversal pattern that appears at the peak of an uptrend. Its unique shape and position on the chart serve as an early indicator that buyers may be losing control, and sellers are starting to gain momentum. When this pattern emerges, it often signals that the market could soon shift from rising to falling prices.
Anatomy of the Hanging Man
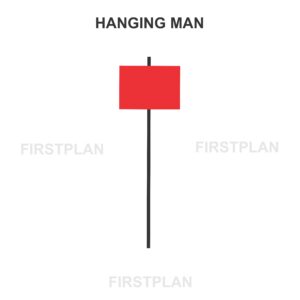
To identify a hanging man candlestick, look for the following features:
Visualizing the Pattern
Picture a candlestick where the body sits at the very top, with a long tail stretching downward and little to no wick above. This formation resembles an upside-down hammer and is easy to spot once you know what to look for.
What the Hanging Man Reveals About Market Sentiment
The story told by the hanging man candlestick is one of shifting power. The session begins with buyers in control, pushing prices upward. However, sellers soon step in, driving the price down sharply. Although buyers manage to recover some ground before the session ends, the fact that sellers were able to exert such pressure is a red flag. This pattern warns traders that bullish momentum may be fading, and a reversal to a downtrend could be on the horizon.
A Real-World Example of the Hanging Man
Imagine a stock that opens at $100. During the session, buyers push the price up to $105, but then sellers take over, dragging it down to $90. By the close, the price recovers slightly to $98. The resulting candlestick would look like this:
This configuration forms a classic hanging man, signaling that buyers are losing their grip and a bearish reversal may be imminent.
How to Trade the Hanging Man Pattern
Recognizing the hanging man is only the first step. To trade this pattern effectively, consider the following strategies:
A single candlestick pattern is rarely enough to act on. Look for a bearish candlestick on the next trading session to confirm the reversal. Increased trading volume during the hanging man or the following candle can further strengthen the signal.
Once confirmation appears, consider entering a short position just below the low of the hanging man candlestick. This approach helps you capitalize on the potential downtrend.
Always protect your position with a stop loss. Place it just above the high of the hanging man to limit potential losses if the market does not reverse as expected.
Variations and Related Patterns
Inverted Hanging Man
A close cousin to the hanging man is the inverted hanging man, which features a long upper shadow above the body. While less common, it can also signal a potential bearish reversal after an uptrend.
Why the Hanging Man Matters for Traders
Mastering the identification and interpretation of the hanging man candlestick pattern can give traders a significant edge. By spotting this early warning sign, you can adjust your positions, manage risk more effectively, and seize profit opportunities before the broader market catches on.
Final Thoughts
The hanging man candlestick pattern is a simple yet powerful tool in the technical trader’s arsenal. Its distinctive shape and clear message make it an essential signal for anyone looking to anticipate market reversals. By combining pattern recognition with prudent trading strategies, you can navigate market shifts with greater confidence and precision.
Whether you are a seasoned trader or just starting out, keeping an eye out for the hanging man could be the key to unlocking new levels of trading success.