Unlocking Market Reversals with the Hammer Candlestick Pattern
When navigating the complex world of trading, recognizing key signals that hint at market reversals can be a game-changer. One such powerful indicator is the hammer candlestick pattern—a visual cue that often marks the turning point from a downtrend to a fresh upward momentum. Understanding this pattern in depth can equip traders with the insight needed to make informed decisions and seize new opportunities.
What Is the Hammer Candlestick Pattern
The hammer candlestick is a distinct bullish reversal signal that typically emerges at the end of a declining market phase. It tells a story of resilience: sellers initially push prices sharply downward, creating a deep low during the trading session. However, buyers rally back with strength, driving the closing price near or even above the opening level by the session’s end. This tug-of-war between sellers and buyers results in a unique candlestick shape that traders watch closely as a potential sign that the market is ready to shift gears and begin climbing.

Key Features That Define the Hammer
To accurately identify a hammer candlestick, it’s essential to focus on several defining characteristics:
Small Real Body Near the Top
The “real body” of the candle—the area between the opening and closing prices—is relatively small and positioned near the upper end of the candlestick’s range. This narrow gap highlights that despite volatility, the session closed close to where it opened.
Long Lower Shadow
The lower wick, or shadow, extends downward and is at least twice the length of the real body. This long tail reveals significant selling pressure during the session, as prices plunged well below the opening level before buyers stepped in.
Minimal or No Upper Shadow
Unlike the lower shadow, the upper wick is either very short or nonexistent. This means the price didn’t move much above the closing level, reinforcing the idea that buyers managed to hold the ground near the session’s high.
Color of the Body
The body can be green or red. A green body indicates the close was higher than the open, signaling stronger buying momentum, while a red body shows the close was slightly below the open but still near it. Both colors can indicate a potential reversal when the pattern appears after a downtrend, though green is often viewed as a more confident bullish sign.
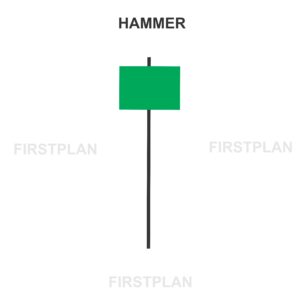
Visualizing the Hammer Candlestick
Picture the hammer as a capital “T” on your trading chart. The small rectangular body sits at the top, balanced on a long vertical line that stretches downward. This shape vividly captures the battle between sellers and buyers: sellers drove prices down hard, but buyers reclaimed control by the close. The simplicity and distinctiveness of this shape make it easy to spot even in volatile markets.
What the Hammer Signals to Traders
The hammer pattern is a visual narrative of market psychology. It suggests that although sellers dominated early on, pushing prices lower, buyers regained strength and shifted momentum by the session’s end. This reversal of control often signals that the downtrend is losing steam and a bullish turnaround may be underway. Traders look for this pattern as an early warning that a market bottom might be forming and that upward price movement could follow.
Real-World Example of a Hammer Candlestick
Imagine a stock that opens at $100. During the trading session, the price drops sharply to $90, stirring fear among sellers. Yet, as the session progresses, buyers step in forcefully, pushing the price back up to close at $98. The resulting candlestick perfectly fits the hammer profile:
The small difference between the open and close, paired with the long lower shadow, tells the story of a market ready to reverse course.
How to Trade Using the Hammer Pattern
Recognizing a hammer is just the first step. Successful trading requires confirmation and disciplined risk management:
Seek Confirmation
Wait for the next candlestick to confirm the reversal. A bullish candle following the hammer strengthens the signal that an upward trend is beginning.
Determine Entry Point
A common strategy is to enter a long position once the price moves above the high of the hammer candlestick. This helps ensure the market is indeed shifting upward.
Manage Risk with Stop Loss
Place a stop loss just below the hammer’s low. This protects against unexpected downward moves and limits potential losses.
Watch Trading Volume
Higher trading volume during the hammer formation or on the confirming candle adds credibility to the reversal signal, indicating strong buyer interest.
Summary of Hammer Candlestick Characteristics
| Feature | Description |
| Body Size | Small, near the top of the candlestick range |
| Lower Shadow | Long, at least twice the length of the body |
| Upper Shadow | Minimal or none |
| Body Color | Green (bullish) or red (bearish); green preferred |
| Typical Context | Appears after a downtrend |
| Signal Meaning | Indicates potential bullish reversal |
Final Thoughts on Harnessing the Hammer Pattern
Mastering the hammer candlestick pattern empowers traders to spot potential market bottoms and capitalize on emerging bullish trends. While no single indicator guarantees success, combining the hammer with other technical tools and volume analysis can significantly enhance trading decisions. By paying close attention to this simple yet powerful pattern, traders can navigate market shifts with greater confidence and precision.