Discovering the Bullish Harami Candlestick Pattern and Its Role in Signaling Market Reversals
In the complex world of trading, recognizing subtle shifts in market sentiment can unlock valuable opportunities. One such powerful indicator is the Bullish Harami candlestick pattern—a two-candle formation that often marks the turning point from a downtrend to an uptrend. This pattern reveals the moment when sellers begin to lose grip and buyers start gaining momentum, offering traders a clear signal of a potential bullish reversal. Understanding the Bullish Harami can enhance your ability to anticipate market movements and make informed trading decisions.
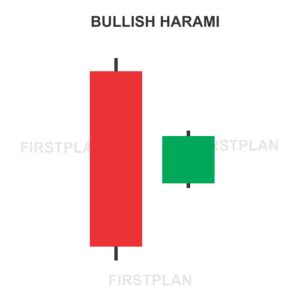
What Is the Bullish Harami Candlestick Pattern
The Bullish Harami is a classic two-candlestick pattern that typically appears at the end of a downtrend. It consists of:
This formation suggests that the intense selling momentum is weakening, and buyers are beginning to step in, potentially reversing the downward trend.
Key Features That Define the Bullish Harami
To identify the Bullish Harami accurately, traders should focus on the following characteristics:
Visualizing the Bullish Harami Pattern
Imagine a stock that opens at $100, falls sharply to $90, and closes at $92, forming a large red candle that signals selling pressure. The following day, the stock opens at $91 and closes slightly higher at $95, creating a small green candle fully contained within the previous day’s range. This compact green candle within the larger red one illustrates the market’s hesitation to continue falling and hints at a possible reversal.
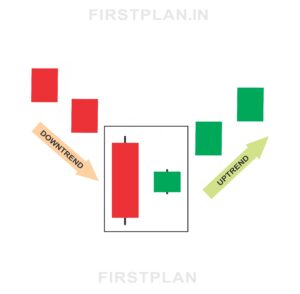
What the Bullish Harami Reveals About Market Sentiment
The Bullish Harami pattern indicates a shift in market dynamics. The small green candle inside the large red candle signals that selling pressure is losing steam, and buyers are beginning to assert influence. This change suggests that the downtrend may be coming to an end, and an upward reversal could be on the horizon.
How to Trade the Bullish Harami Pattern Effectively
Trading the Bullish Harami pattern requires patience and confirmation to ensure reliability. Here’s a step-by-step approach:
Variations and Related Patterns
Why the Bullish Harami Matters for Traders
The Bullish Harami is a subtle yet powerful pattern that provides early clues about a potential shift in market momentum. Its distinctive formation makes it easy to spot on charts, while its implications offer actionable insights into changing sentiment. By incorporating the Bullish Harami into your trading strategy, you can improve your timing and increase the likelihood of entering trades at the start of profitable upward moves.
Final Thoughts on the Bullish Harami Candlestick Pattern
The Bullish Harami candlestick pattern tells a compelling story of transition—a moment when buyers quietly begin to challenge the sellers’ dominance. Recognizing this pattern equips traders with the foresight to anticipate bullish reversals and capitalize on emerging trends. Whether you are a seasoned trader or just beginning your journey, mastering the Bullish Harami can enhance your understanding of market psychology and improve your trading outcomes.
By paying close attention to these two candles, you gain valuable insight into the subtle shifts that drive market momentum, enabling you to make smarter, more confident trading decisions.