Understanding the Bearish Harami Candlestick Pattern and How It Signals Market Reversals
In the world of trading, recognizing when an uptrend is losing steam can be crucial for protecting profits and capitalizing on new opportunities. One of the most subtle yet powerful indicators of a potential market reversal is the Bearish Harami candlestick pattern. This two-candle formation reveals a shift in momentum, signaling that sellers may be gaining control after a period of buying strength. By understanding the Bearish Harami, traders can better anticipate downward moves and position themselves accordingly.
What Is the Bearish Harami Candlestick Pattern
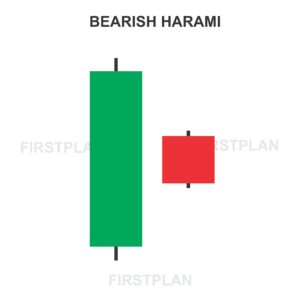
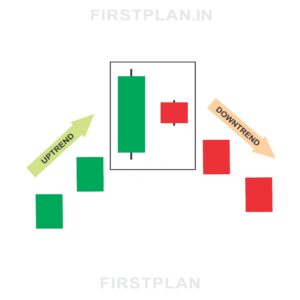
The Bearish Harami is a classic two-candlestick pattern that usually appears at the end of an uptrend. It consists of:
This pattern suggests that the buying momentum is weakening and sellers are starting to assert influence, potentially signaling a reversal from rising prices to falling prices.
Key Features of the Bearish Harami Pattern
To spot the Bearish Harami effectively, traders should look for these defining characteristics:
Visualizing the Bearish Harami Pattern
Imagine a stock that opens at $100, rises to $110, and closes at $108, forming a large green candle that signals buying strength. The next day, the stock opens at $107 but closes lower at $103, creating a small red candle fully contained within the previous day’s range. This smaller red candle inside the larger green one illustrates the market’s hesitation to continue climbing and hints at a possible reversal.
What the Bearish Harami Reveals About Market Sentiment
The Bearish Harami pattern indicates a shift in market dynamics. The small red candle inside the large green candle signals that buying pressure is fading and selling pressure is emerging. This change suggests that the uptrend may be losing momentum, and a downward reversal could be imminent.
How to Trade the Bearish Harami Pattern
Trading the Bearish Harami pattern requires confirmation and careful risk management. Here’s how to approach it:
Variations and Related Patterns
Why the Bearish Harami Is Valuable for Traders
The Bearish Harami is a subtle yet insightful pattern that offers early clues about a potential shift in momentum. Its distinctive formation makes it easy to spot on charts, and its implications provide actionable insights into changing market sentiment. By incorporating the Bearish Harami into your trading strategy, you can improve your timing and increase the likelihood of entering trades ahead of profitable downtrends.
Final Thoughts on the Bearish Harami Candlestick Pattern
The Bearish Harami candlestick pattern tells a story of transition—a moment when sellers quietly begin to challenge the buyers’ dominance. Recognizing this pattern equips traders with the foresight to anticipate bearish reversals and adjust their strategies accordingly. Whether you are an experienced trader or new to technical analysis, mastering the Bearish Harami can enhance your understanding of market psychology and improve your trading results.
By paying close attention to these two candles, you gain valuable insight into the subtle shifts that drive market momentum, enabling smarter and more confident trading decisions.